How to Build a Multi-Source Lakehouse in Days (Not Months) with Hiop - A Practical Guide for Analytics Engineers and Managers
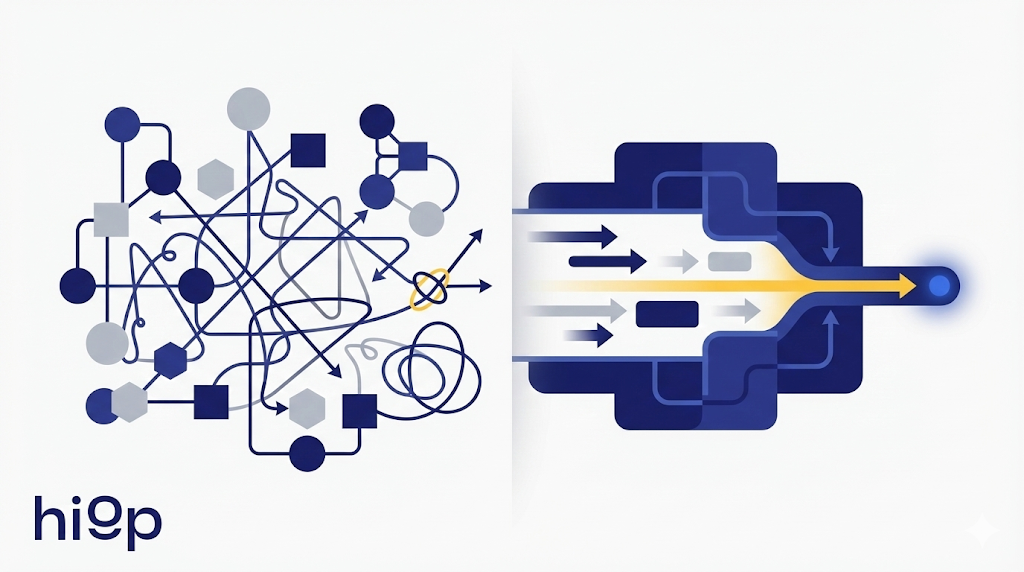
The lakehouse isn’t the hard part anymore. Delta, Iceberg, and Hudi solved storage. What still breaks teams is ops: ingestion, orchestration, transforms, quality, metadata, observability - spread across 6+ tools. What if that collapsed into one declarative spec?

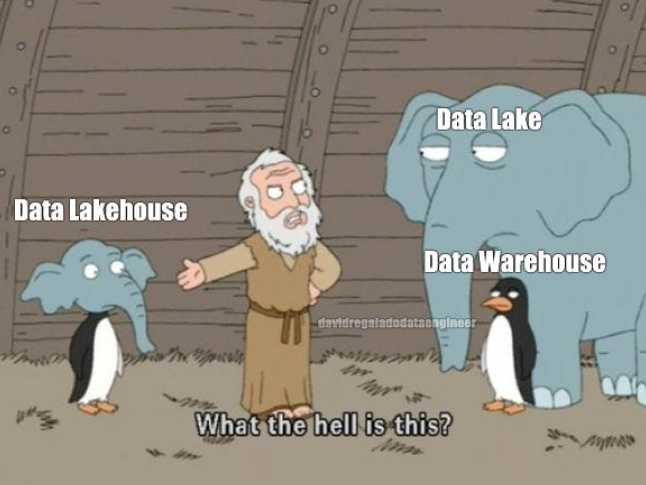
The Lakehouse Promise vs Reality
Data lakehouses combine cheap object storage with ACID transactions, schema enforcement, and warehouse-grade query performance. Delta Lake, Iceberg, and Hudi solved the technical foundation years ago.
By merging lake and warehouse functionality, lakehouses reduce the need to ETL data into multiple systems and help avoid siloed copies of the same datasets. Organizations use them to enable a “single source of truth” that serves dashboards, ad-hoc analytics, data science, and AI workloads from one unified platform.
So why is everyone still struggling to build one?
Because the problem isn't storage formats. It's operational complexity.
To run a production lakehouse, you need:
- Ingestion: Airbyte, Fivetran, or custom connectors
- Transformation: dbt, Spark jobs, or SQL pipelines
- Orchestration: Airflow, Prefect, Dagster
- Quality: Great Expectations, Soda, Monte Carlo
- Catalog: DataHub, Amundsen, or Atlan
- Monitoring: Grafana, Datadog, custom dashboards
That's 6+ platforms. Each with its own config, auth, deployment, versioning, and ops overhead.
The real complexities:
- Tool sprawl kills velocityIntegrating storage, table formats, catalogs, pipelines, BI, and governance tools creates fragmented stacks. Most teams spend more time maintaining the platform than using it.
- Org friction blocks adoptionCentralizing data raises ownership questions: Who owns datasets? Who builds models? Who supports analysts? Unclear responsibilities create bottlenecks between central and business teams.
- Metadata is where lakehouses dieData is useless if it can't be found or understood. Poor metadata, missing documentation, and weak lineage kill trust and adoption faster than any technical failure.
- Skills gap + infrastructure overheadBuilding a lakehouse requires hard skills across data engineering, platform ops, analytics, and governance. Hiring takes months. Infrastructure setup takes longer.
The lakehouse architecture is sound. The operational burden is what breaks teams. What if you could skip the platform assembly entirely?

What is Hiop
Hiop Platform is an infrastructure-less data logistics platform. It’s designed for teams that need to move fast and don’t want to deal with infrastructure.
Think of it as your:
- Universal connector for all your data sources
- low-code pipeline builder, with MCP and AI superpowers
- Builtin data orchestrator that scales invisibly
- Governance-friendly engine that doesn't make your CISO nervous
And best of all? It’s self-deploying, meaning you don’t have to wait for IT or DevOps to get started.
Hiop’s Core Idea is to stop treating infrastructure as a prerequisite for analytics. Just connect, transform, and go.
Step 1: Connect Your Sources
Ingest raw data into the bronze layer using connectors for:
- Databases (SQL or NoSQL)
- Files such as CSV, Excel, or JSON
- Real-time streaming sources
- APIs for CRMs, ERPs, and external applications
To run this task, you need:
- Tools that connect and ingest your data
- Tools that validate the schema of your data
What happens with Hiop?
Think of Hiop as a universal data bridge: not another heavy platform but a lightweight layer that lets your data talk to each other where they already live.
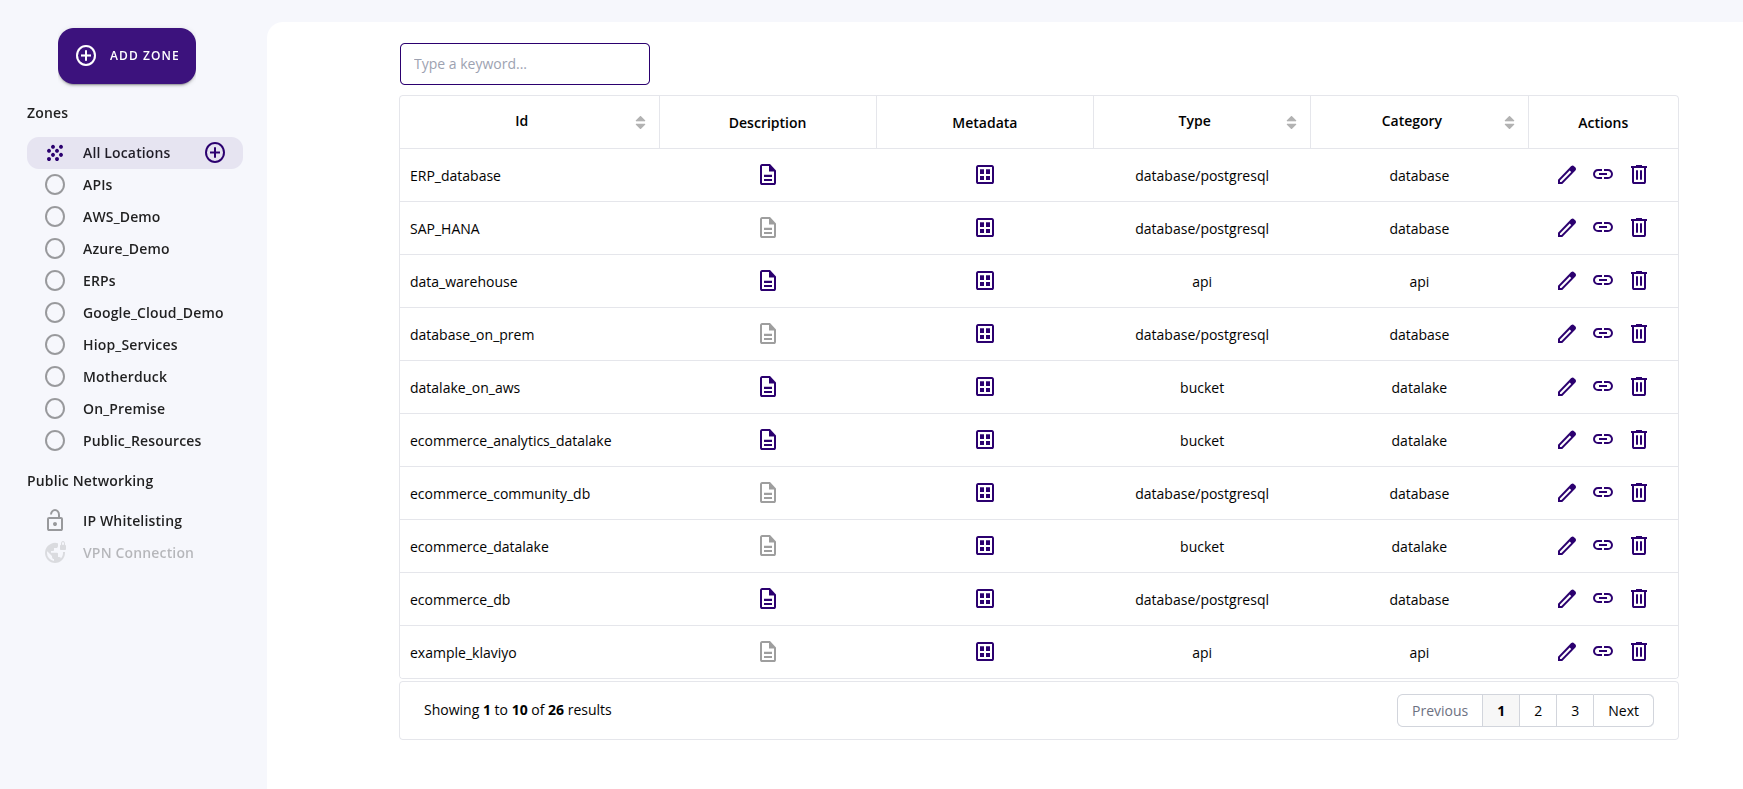
Hiop can easily connect to hundreds of locations including:
- Databases both SQL and NoSQL
- APIs and SaaS tools
- Files and object storage of different clouds (AWS, Azure, Google)
Step 2: Transform Your Data
Run ELT jobs to process the bronze layer and transform it into:
- Silver: after cleaning, deduplication, and schema enforcement
- Gold: after aggregations, ML feature generation, and business view creation
Apply schema evolution, joins, and incremental updates. The final goal is to populate catalog metadata and lineage, creating curated, queryable datasets ready for analytics.
You need:
- Tools for ELT and data processing
- Tools to orchestrate workflows
- Tools to manage catalogs and metadata
What happens with Hiop?
Hiop brings everything together: ELT or ETL, orchestration, and data catalog so you don’t need to implement multiple tools.
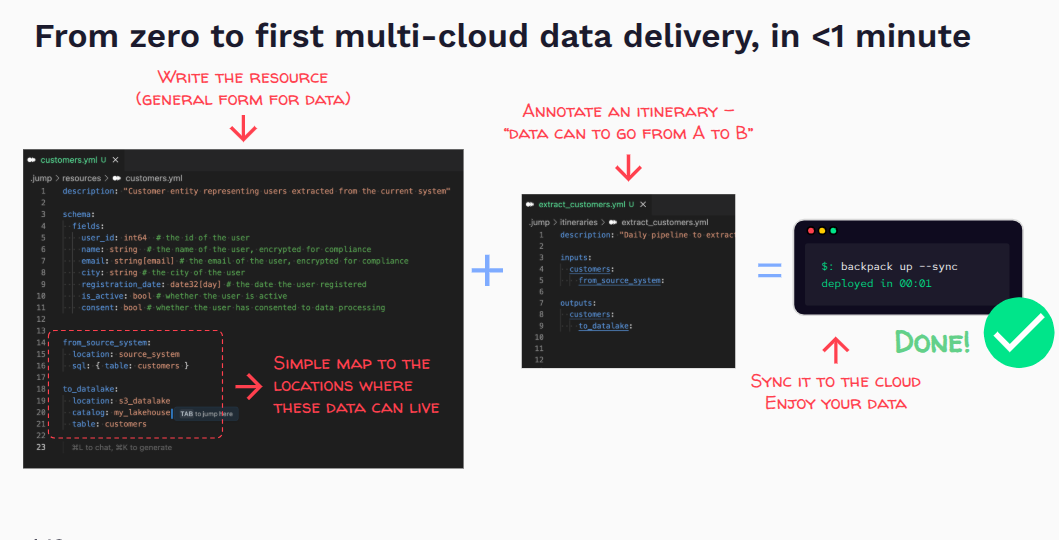
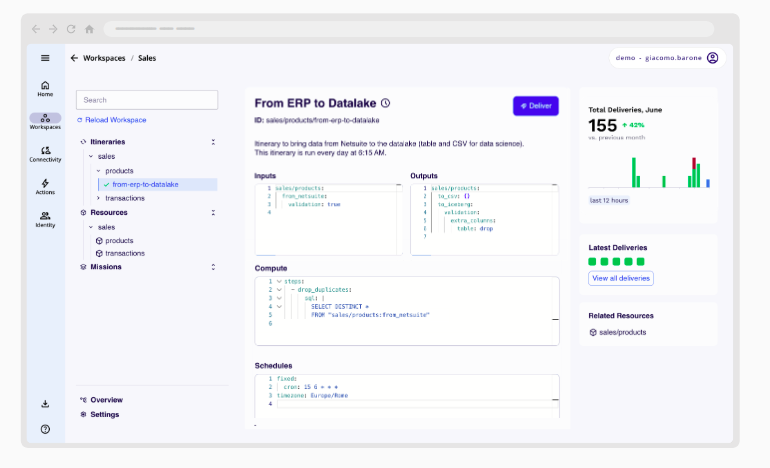
With less than 30 lines of YAML, you can define an entire data transformation pipeline, or itinerary. In a single file, you specify:
- Inputs from various sources
- Transformations to apply
- Outputs to multiple destinations
- Cron schedules or event-driven triggers
All in one platform, all in one place. With the help of AI thanks to our MCP server.
Step 3: Validate Data and Testing
Execute workloads that verify data freshness, nulls, distributions, and SLAs. Validate schemas and run integration tests across complete pipelines.
You need:
- Tools for data quality assertions
- Tools for testing pipelines and code
What happens with Hiop?
Hiop lets you validate your data directly from YAML files, ensuring everything you read strictly follows the schema you define.
You can:
- Enable validation levels to control how strict the checks are
- Apply casting rules to automatically align data types
- Define validators at both:
- Column level (e.g. ranges, formats, required values)
- Table level (e.g. cross-column or global consistency rules)
Beyond column names and data types, these validators help guarantee that your data is not just well-structured but also correct.
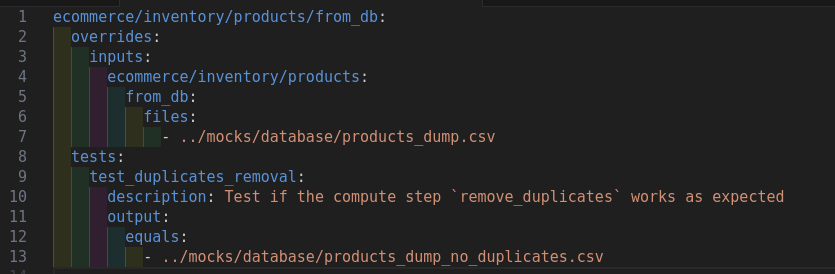
Before going live, Hiop lets you run automated tests locally on a set of pre fake generated datasets. This makes it easy to verify that your itinerary behaves exactly as expected—before deploying it to production.
Step 4: Go Live and Monitor
Schedule orchestrators or cron jobs for production runs. Configure alerts for failures, enable backfills, and monitor cost and performance.
Set up CI/CD for pipeline changes and conduct regular audits.
You need:
- Tools for scheduling
- Tools for alerting and notifications
- Tools for monitoring and observability
What happens with Hiop?
Once schedules and orchestration events are defined in the YAML specification, execution and health monitoring are managed directly from the Hiop web console. You can configure email alerts, automatic retries, and downstream triggers when events (such as failures) occur.
In addition, embedded analytics provide a real-time view of your workspace’s global health, making it easy to monitor performance at a glance.
Conclusions
Most lakehouse projects never finish. Not because the architecture is wrong - Delta Lake and Iceberg solved that years ago.
They stall because teams spend more time maintaining the platform than using it. Airbyte breaks. Airflow needs upgrading. dbt models drift. Great Expectations tests go stale. You wanted a lakehouse. You got a full-time ops job.
The real question isn't whether to adopt a lakehouse. It's whether you can afford the operational burden - or whether you collapse six platforms into one YAML file and ship next week.
Same lakehouse capabilities. One platform instead of six+.